
It’s that time again. How much of item 12345 do I need to buy? I purchased 100 units the last two months, but demand seems to have increased a little, almost 10%, and inventory is lower than it usually is, so maybe I’ll buy 110 this time? Is this your buying process? Ugh!
I apologize right now that I’m an engineer and very number driven, especially when it comes to procurement (buying) and inventory management. As background, I’ve rebuilt supply chains, planning, purchasing, scheduling, manufacturing and warehousing operations for many companies in the outdoor sports industry before becoming the CEO and President of two of them. In every case, we’ve been able to reduce inventory and increase fill rates by using numbers and formulas.
Now, not to oversimplify purchasing and inventory management because there are a number of variables which impact both, specifically demand, and we all know demand keeps changing. But, that is also the reason to use numbers and formulas so you don’t guess what to buy and store. For this article, I’m going to focus on classifying your inventory in A, B & C buckets and on service levels as those two drive the rest of the process and formulas.
A-B-C Inventory
All items are not equal. Some generate a very high gross profit margin percentage and some generate high gross profit dollars. Ideally many do both. You should classify your inventory in A, B and C buckets so you can focus on your more important items, reduce inventory and increase profits. Your A items are most important followed by B then C. The graphic below shows a typical Pareto analysis in determining which items to categorize as A, B or C.
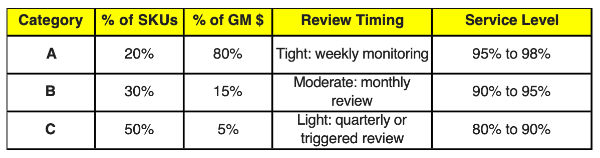
I’m surprised how many companies don’t implement this basic planning discipline as it helps tremendously with managing purchases and inventory. At one of the companies I was leading, the buyers were not using A, B, C classifications and therefore reviewing all SKUs every time they ran a planned order report. They spent a lot of wasted time ruling out those items they didn’t need to review and trying to identify the more important ones. When we implemented the A, B, C categories, they ran reports for only the A items weekly, the B items every two weeks and the C items monthly. It saved a lot of time and significantly improved the buying process.
Service Levels
Now that you’ve identified your A, B and C items, you now need to decide how often you want to have that item in stock when ordered. This is called the service level, and it typically ranges from 80% to 99%. The higher the service level, the higher the amount of inventory you have, some consider it safety stock, but that also increases your order fill rate, revenues and profits. Typically, your A items will have service levels in the 95% to 98% range, B’s in the 90% to 95% range and C’s in the 80% to 90%.
Ideally your ERP or MRP system has fields for these classifications, but I’ve found that many don’t. We’ve typically used offline tools to make these calculations but they have been well worth it. We’ll review and refresh the classifications and service levels maybe twice a year.
Summary
So let’s rerun the buying process again with these improvements. We’ll focus on the A items. It’s the beginning of the week and we run the “A Items to Purchase Report”. It first only reviews the A items. The computer looks at the current inventory quantity, average historical demand (might need an article on this also), delivery lead time, service level, economic order quantity (damn, maybe another article) and recommends how many to buy. You review the recommendations, make some changes based on the monthly sales forecast (yeah, I know you don’t have one…) then hit submit. You can run the “B items to Purchase Report” in the next week or two.
By categorizing your items and adding service levels, you’ll remove the guessing of what to buy, buy the correct amount, typically reducing inventory in your B and definitely C items but buying more of your A items which increases sales and profits. Easy!
– Chris DiCenso, Growth Strategy Partners